We are excited to introduce a new resource – the Thermal Calendars tool!
Tracking warmth accumulation in the northeastern U.S.
Temperature is an important factor governing when seasonal events happen in many plant and animal species. For many species, events like leaf-out, flowering, and egg hatch are triggered when a specific amount of heat has accumulated since the start of the year. We typically measure accumulated heat in growing degree days (GDDs).
The Thermal Calendars tool indicates when particular GDD levels (or thresholds) of accumulated warmth are met each year in the northeastern U.S. Local resource managers can use the tool to determine when problematic insect pests are expected to enter particular life stages when they may cause the most damage or are most readily controlled. The tool displays maps that indicate the date on which growing degree day thresholds have been reached in the current year and information about how conditions in the current year differ from conditions averaged over a recent 30-year period. Users can select growing degree day thresholds that range from 50 GDDs to 2500 GDDs in 50 GDD increments. Users can zoom, pan, and extract values for specific locations.
See what is happening this year
We invite you to check out the Thermal Calendars tool. You can use the tool to see how fast heat is accumulating at your location this year or to look at regional patterns and explore how this year compares to historical averages.
For additional information, see the Thermal Calendars Info Sheet.
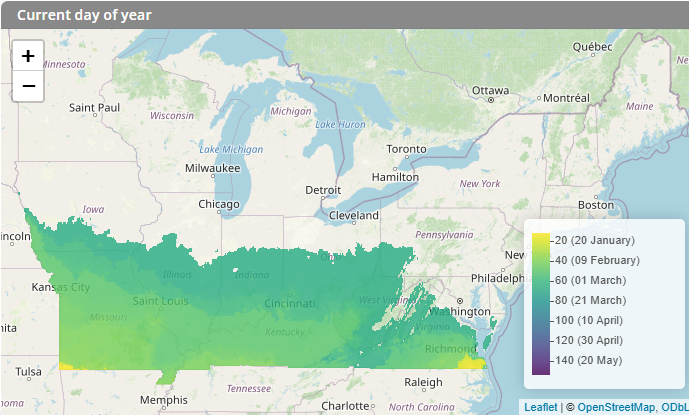
The graphic below displays maps from the Thermal Calendars Tool for an accumulated growing degree day threshold of 400GDD (°F) in 2025. The map at the top left shows the dates on which the threshold was reached in 2025, and the map at the top right displays how many days earlier or later the 2025 date is relative to the average date between 1991 and 2020. The map at the bottom left displays the average date the threshold was reached between 1991 and 2020, and the map at the bottom right displays the variability, in days, around the long-term average date.

Funding to develop the Thermal Calendars tool was provided by the Northeast Climate Adaptation Science Center.