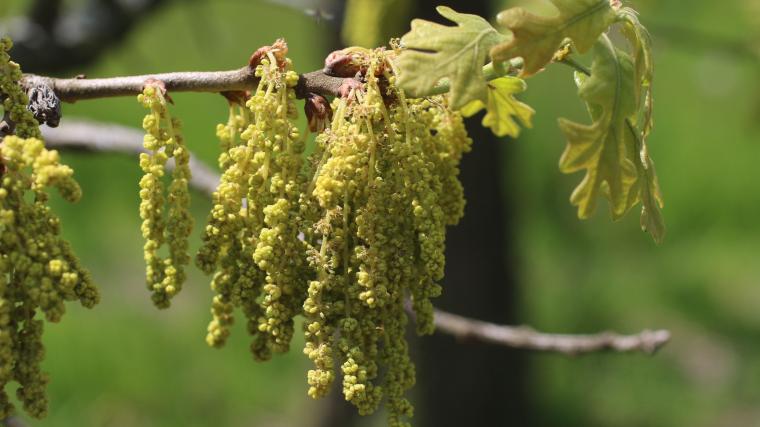
Volunteer reports of blooms predict allergy season
This in-depth guide describes everything you need to know to create a Local Phenology Program, from planning your program to getting your program set up in Nature's Notebook and in the field.
This 10-step guide helps you to plan your Local Phenology Program, including defining your science questions, developing short-, medium-, and long-term goals, identifying stakeholders and resources, creating an action plan to realize your goals and a sustainability plan to maintain your program, and writing an annual report to document your progress and accomplishments.
This guide will help you with developing a report for your Local Phenology Program. A phenology report is a document that describes the status of your phenological monitoring program, including participant statistics, data volume statistics, and patterns in the data. It can be produced for any time scale, such as quarterly on an annual or biannual basis.
Use this editable flyer to advertise your volunteer workshop or training event on how to observe with Nature's Notebook.
You can use this editable info sheet to educate guests and volunteers about your Local Phenology Program. The first page include information about the USA-NPN and Nature's Notebook. The second page includes prompts where you can fill in information and visuals about your program.
Students conduct an investigation using historical photographic records to determine whether the timing of plant phenophases has changed in their own communities. They search for old photos (indicating dates) in their family’s or town’s records that show sites where plants are in specific phenological stages (i.e., peak flower, 90% leaf out [or 90% lack of leaf cover], fruiting, seasonal festivals, etc.), and that show dates of record. They then visit those sites when plants are experiencing those same phenophases and take pictures to compare the past and present timing of seasonal events.
Students will develop their own research field site, learn to make observations and collect data outdoors, build their own dataset and then will learn to plot graphs of that data. They will also learn to use GPS and mapping tools and resources.