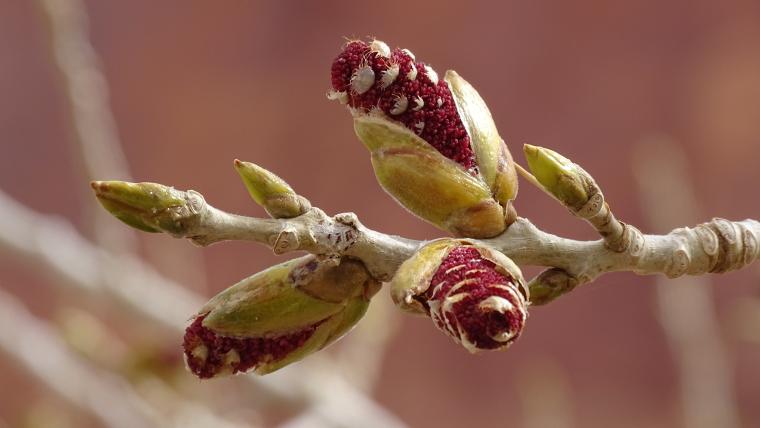
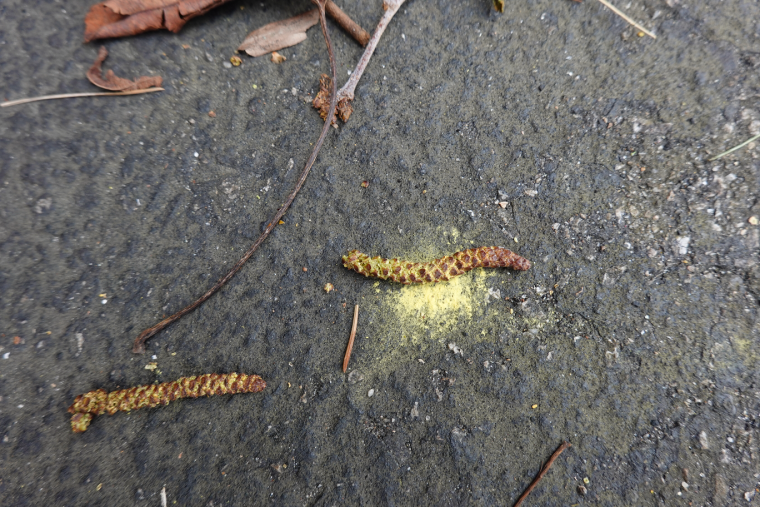
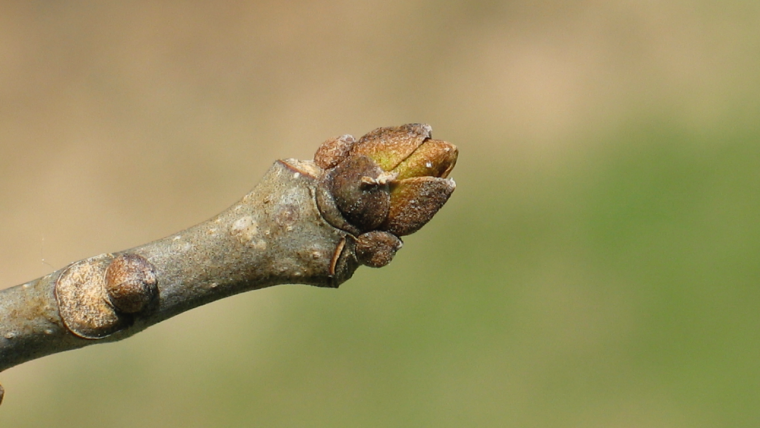
Male and female trees are responding differently to increasing temperatures

March 17-21, 2025
March 16-20, 2026
March 18-22, 2024 is Phenology Week - a virtual celebration of the seasonal cycles of plants and animals! The purpose of Phenology Week is to celebrate YOU, our Nature's Notebook observers, Local Phenology Programs, and partners! We'll have webinars, awards, daily challenges, observer stories, and more!

Each year, people gather to hear Punxsutawney Phil's prediction of what the next six weeks of weather will bring. This year, Phil predicted an early spring! But what does the science say?
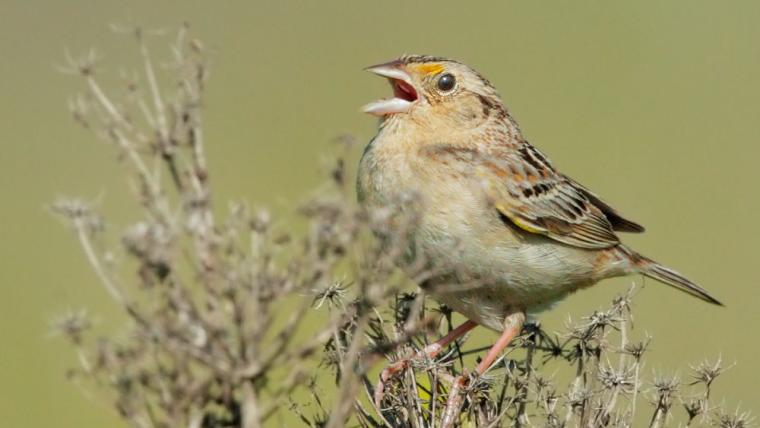
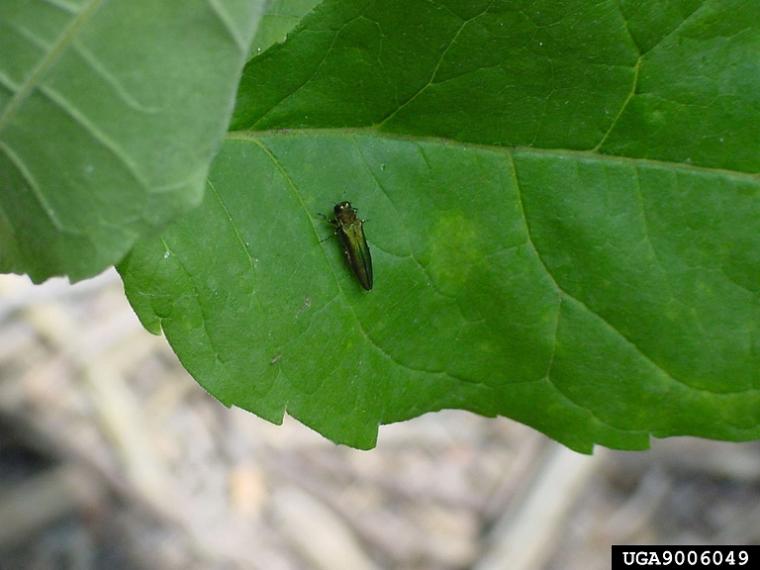
Pheno Forecast maps predict key life cycle stages in invasive and pest species, to improve management efficacy. For insect pest species, Pheno Forecasts are based on published growing degree day (GDD) thresholds for key points in species life cycles. These key points typically represent life cycle stages when management actions are most effective. These maps are updated daily and available 6 days in the future.
Help us improve these maps! Our Pheno Forecast map products are still in development, and we seek input on their performance in your area. Give your feedback at the bottom of the page.
Learn more about this forecast using our visualization tool!
